

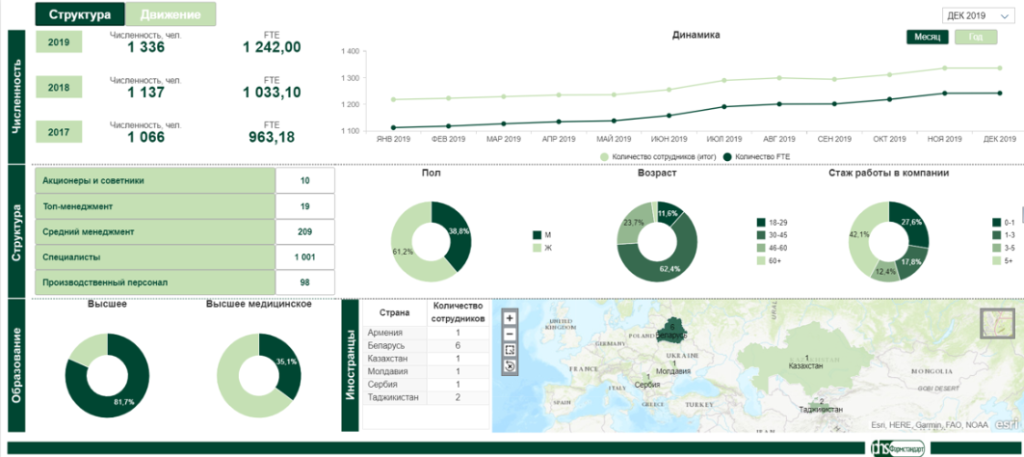
Client: JSC “Pharmstandard”
Project:
HR dashboards with People analytics and Dynamics like Employee Turnover
Technologies:
✔︎ SAP BW, Business Objects
✔︎ SAP Data Services
✔︎ HR System Boss
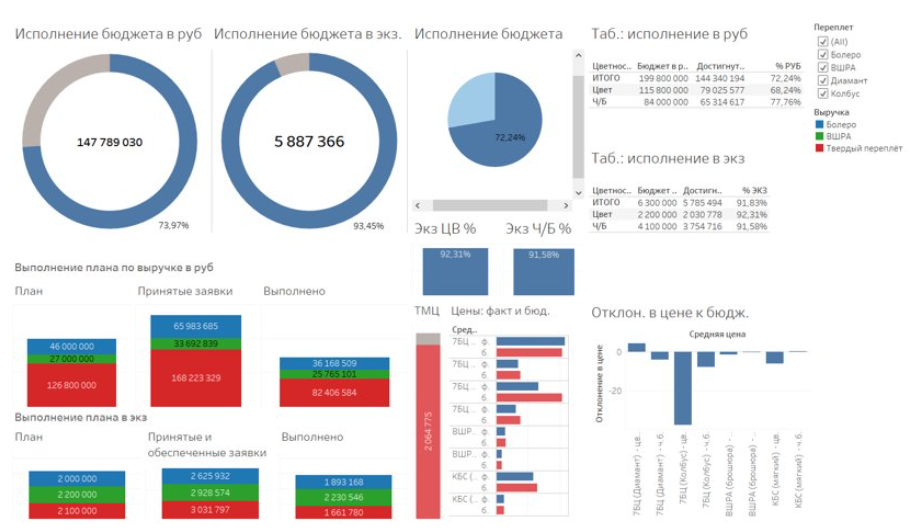
Client: LLC “PARETO-PRINT”
Project:
creating interactive reporting that includes cost and quantity indicators, revenue, plan-vs-actual analysis, broken down by production lines.
Technology stack:
✔︎ Tableau Desktop
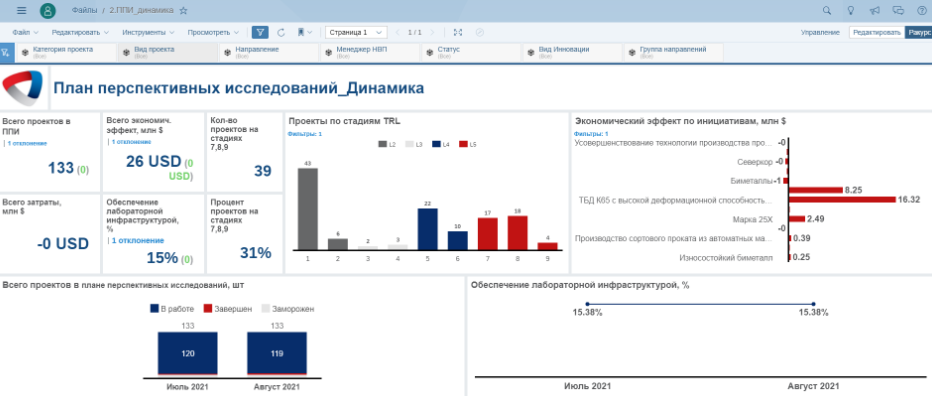
Client: Severstal Group
Project:
Portfolio and Project management dashboards with the TRL indicators, project costs, economic effects
Technology stack:
✔︎ SAP Analytics Cloud, SAP PPM, PS
✔︎ Microsoft Sharepoint